Oil&heat Resistance Comparison Chart
High Temperature or Oil Resistance? Choose the Wrong Dimension, and Your Seal Fails in the Right Environment
Oil and Heat Resistance at a Glance — One Scatter Chart to Intuitively Position the True Performance Range of 16 Rubber Materials
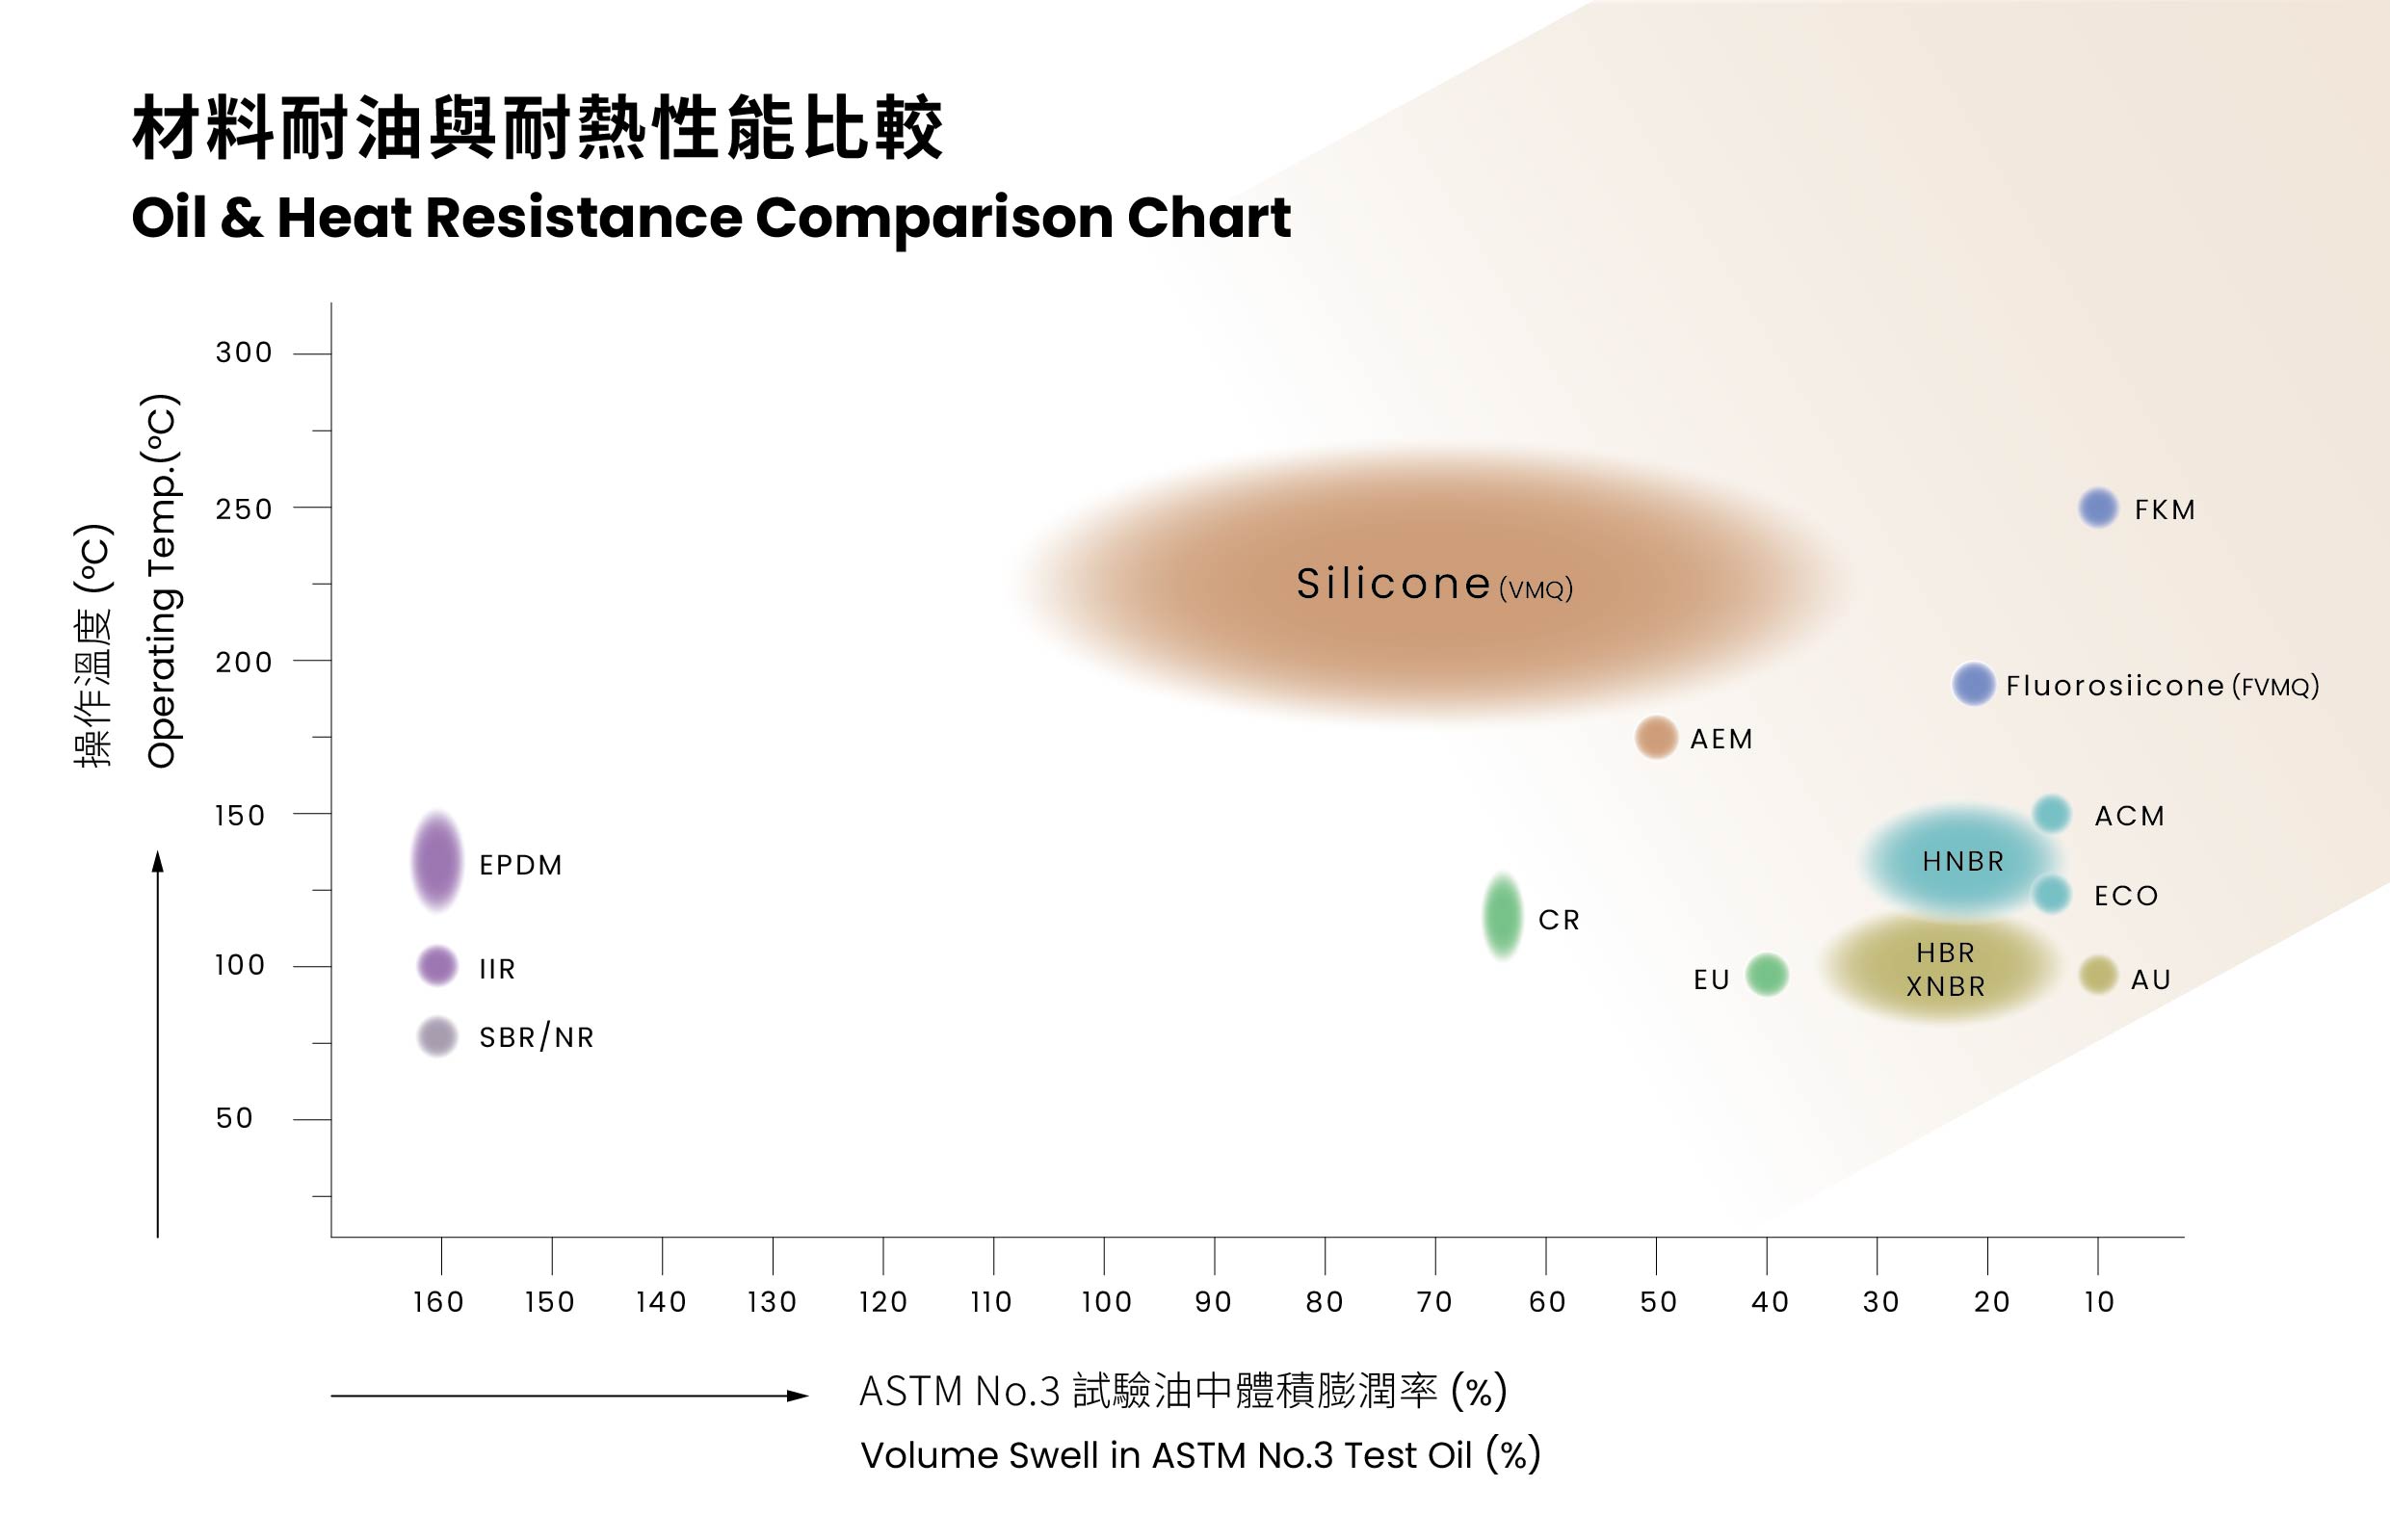
The most common mistake in material selection: focusing only on heat resistance while overlooking oil resistance, or confirming the media while ignoring temperature. NIYOK plots 16 mainstream rubber materials on a single scatter chart — with ASTM No. 3 oil volume swell rate on the horizontal axis and operating temperature on the vertical axis — so the two-dimensional difference between oil and heat resistance is immediately clear, enabling more precise application matching and eliminating unnecessary detours in material selection.
Dual-Axis Matching for Oil × Heat Resistance — Master the Performance Distribution of 16 Rubber Materials in One Chart
Many seal failures occur under seemingly normal operating conditions. The engine bay runs a few degrees hotter than expected. The hydraulic system switches to a new fluid. Outdoor equipment starts leaking after summer heat exposure. Behind these problems, there is usually just one cause: the material selected at the time did not truly correspond to the actual conditions of use.
This scatter chart plots 16 materials — FKM, Fluorosilicone (FVMQ), Silicone (VMQ), HNBR, ACM, AEM, ECO, HBR/XNBR, EPDM, IIR, SBR/NR, CR, EU, and AU — using volume swell rate in ASTM No. 3 oil on the horizontal axis against operating temperature on the vertical axis. Further right means better oil resistance; further up means higher heat resistance, allowing cross-dimensional material comparisons without relying on guesswork.
There is no universal answer to material selection — only whether it fits your operating conditions. NIYOK's R&D and quality assurance teams have extensive experience supporting a wide range of industrial and custom projects, from clarifying operating conditions and recommending materials through sample validation and full mass production — with particular expertise in complex, difficult cases where previous attempts have fallen short.
Can't find a specification that fits your requirements? Contact NIYOK for a customized sealing solution.
- 目錄下載

oil&heat-resistance-comparison-chart
Please download the latest oil&heat-resistance-comparison-chart as follows. Our technical sales team has rich experience and technical expertise in O-rings...
Download
